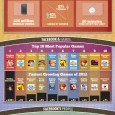
Facebook's rise never ceases to amaze us- from a net income of $229 million in 2009 to a cool $1 billion last year, as illustrated in our latest infographic. Among other things, we look at the number of active Facebook users around the globe (Asia has the most users, but the U.S. has the largest penetration per population), what they actually do on Facebook (like uploading 250 … [Read more...]
Smartphone Market
You may be surprised by some of these stats about smartphone adoption and usage in Japan. For a nation that normally leads the globe in terms of technological advancement and usage they have been very slow with converting to smartphones. This Infographic was published at Search Engine Journal. An Infographic Look at Smartphone Penetration by Infographiclabs … [Read more...]
Small Businesses
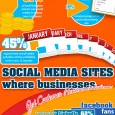
A look at how small businesses are using social media in a world where more and more companies are moving their advertising and marketing to new and social media channels. Thanks to Business Pundit for publishing this Infographic How Small Businesses Are Using Social Media by Infographiclabs … [Read more...]
The Big Mac Index
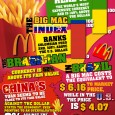
The Big Mac index was developed by The Economist several decades ago to measure the Purchasing Power Parity of nations in a simpler and easier way for people to understand and to set the bar for costs in that nation by which they can measure and compare. This infographic design was published on o5, Recipes For Life The Big Mac Index by Infographiclabs … [Read more...]
Condos vs. Houses
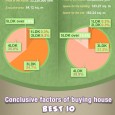
A creative look at the cost comparisons between purchasing a newly built single house against a condominium in Japan. This design was created for Recruit.jp and published on Suumo.jp Publish this infographic to your blog or website Condominium Or Single House - Which One Do You Buy? by Infographiclabs … [Read more...]